


Data Includes:
- Populations and People
- Income and Poverty
- Education
- Employment
- Housing
- Health
- Families and Living Arrangements
- Race and Ethnicity
SOURCE: U.S. Census Bureau

Data Includes:
SOURCE: U.S. Census Bureau
Total Population
Morristown ranks in the top three Morris County municipalities with the largest numerical population increase.
| 2010 | 2020 | Change (numeric) | Change (percent) | |
|---|---|---|---|---|
| Morristown | 18,411 | 20,180 | 1,769 | 9.6% |
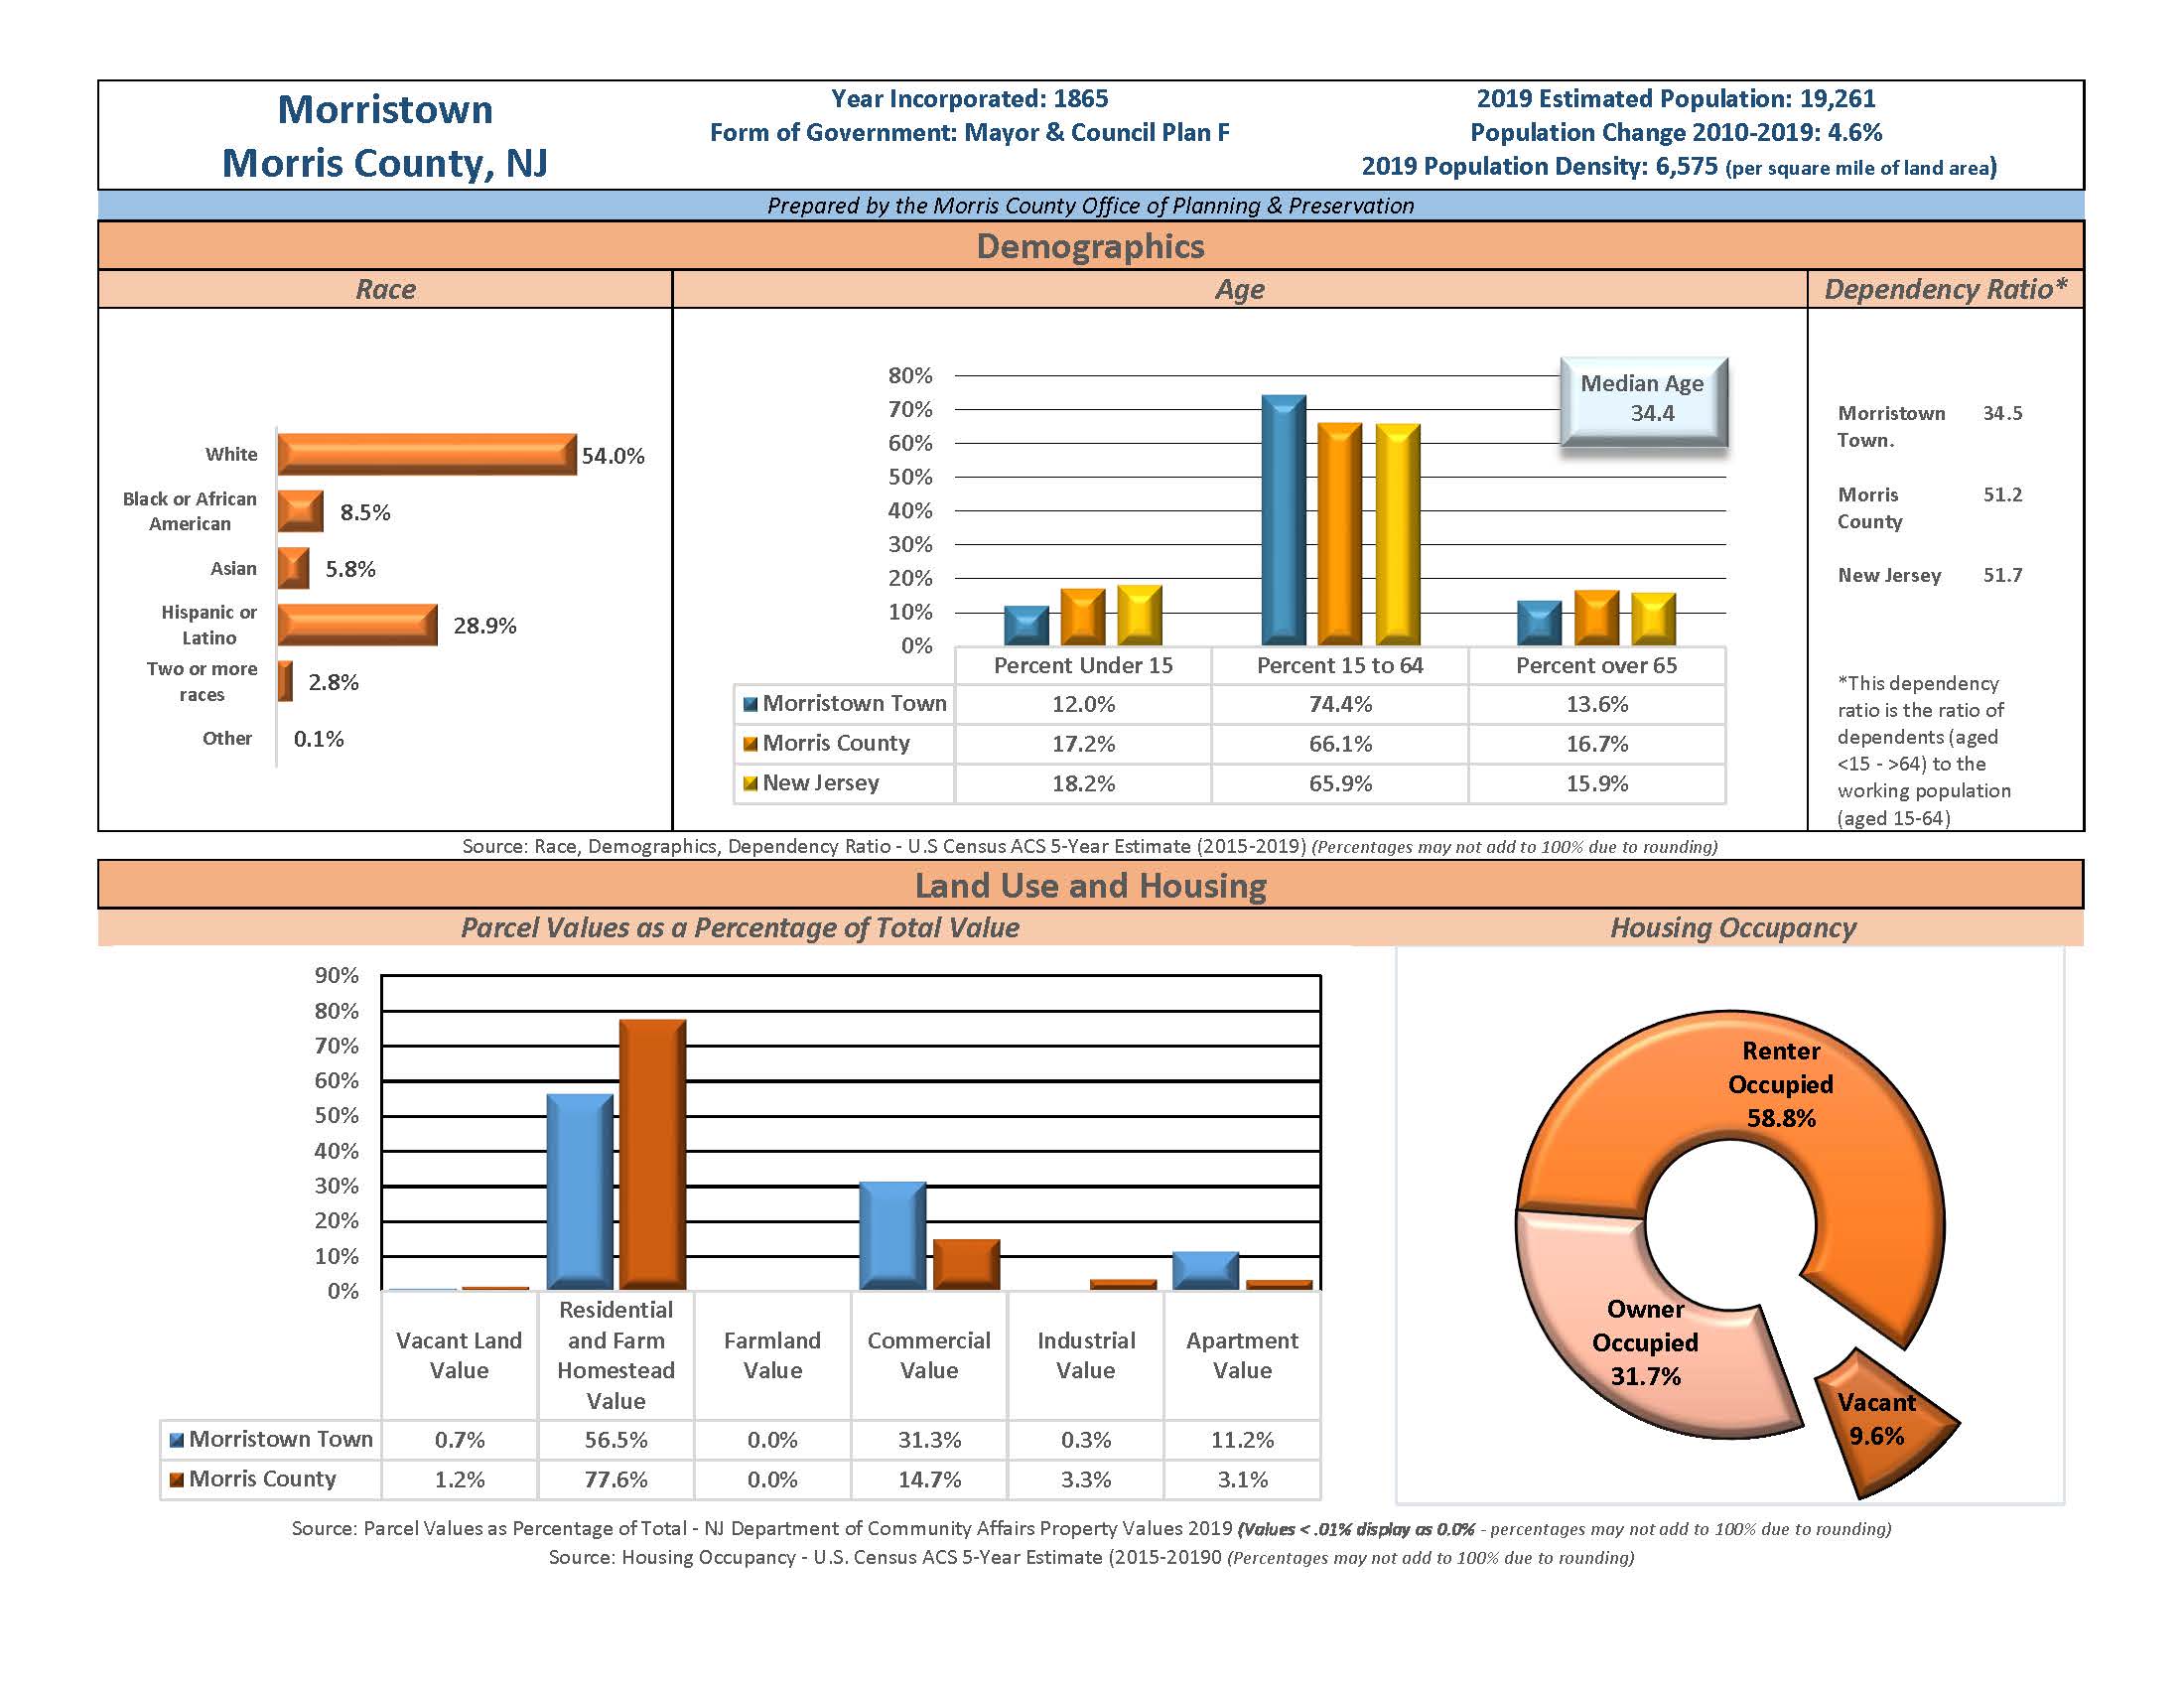
Population by Race and Hispanic Origin
| Municipality | Total Population | Not Hispanic or Latino | Hispanic or Latino (may be of any race) | ||||||
| White | Black or African American | American Indian and Alaska Native | Asian | Native Hawaiian and Other Pacific Islander | Some other race | Two or more races | |||
| Morristown | 20,180 | 9,198 | 1,961 | 28 | 961 | 11 | 128 | 526 | 7,367 |
| Morris County | 509,285 | 341,175 | 15,586 | 373 | 57,700 | 93 | 2337 | 15,360 | 76,661 |
| New Jersey | 9,288,994 | 4,816,381 | 1,154,142 | 11,206 | 942,921 | 1,944 | 70,354 | 289,471 | 2,002,575 |
Housing Unit Change, 2010 – 2020
| Municipality | Total Units | Change in Units | Vacancy Rate | |||
| 2010 | 2020 | Numeric | Percent | 2010 | 2020 | |
| Morristown | 8,172 | 9,213 | 1,041 | 12.7% | 9.2% | 7.9% |
| Morris County | 189,842 | 197,722 | 7,880 | 4.2% | 4.9% | 4.7% |
| New Jersey | 3,553,569 | 3,761,229 | 207,660 | 5.8% | 9.5% | 8.9% |
SOURCE: U.S. Census Bureau, 2010 and 2020 Census
Prepared by the Morris County Office of Planning & Preservation
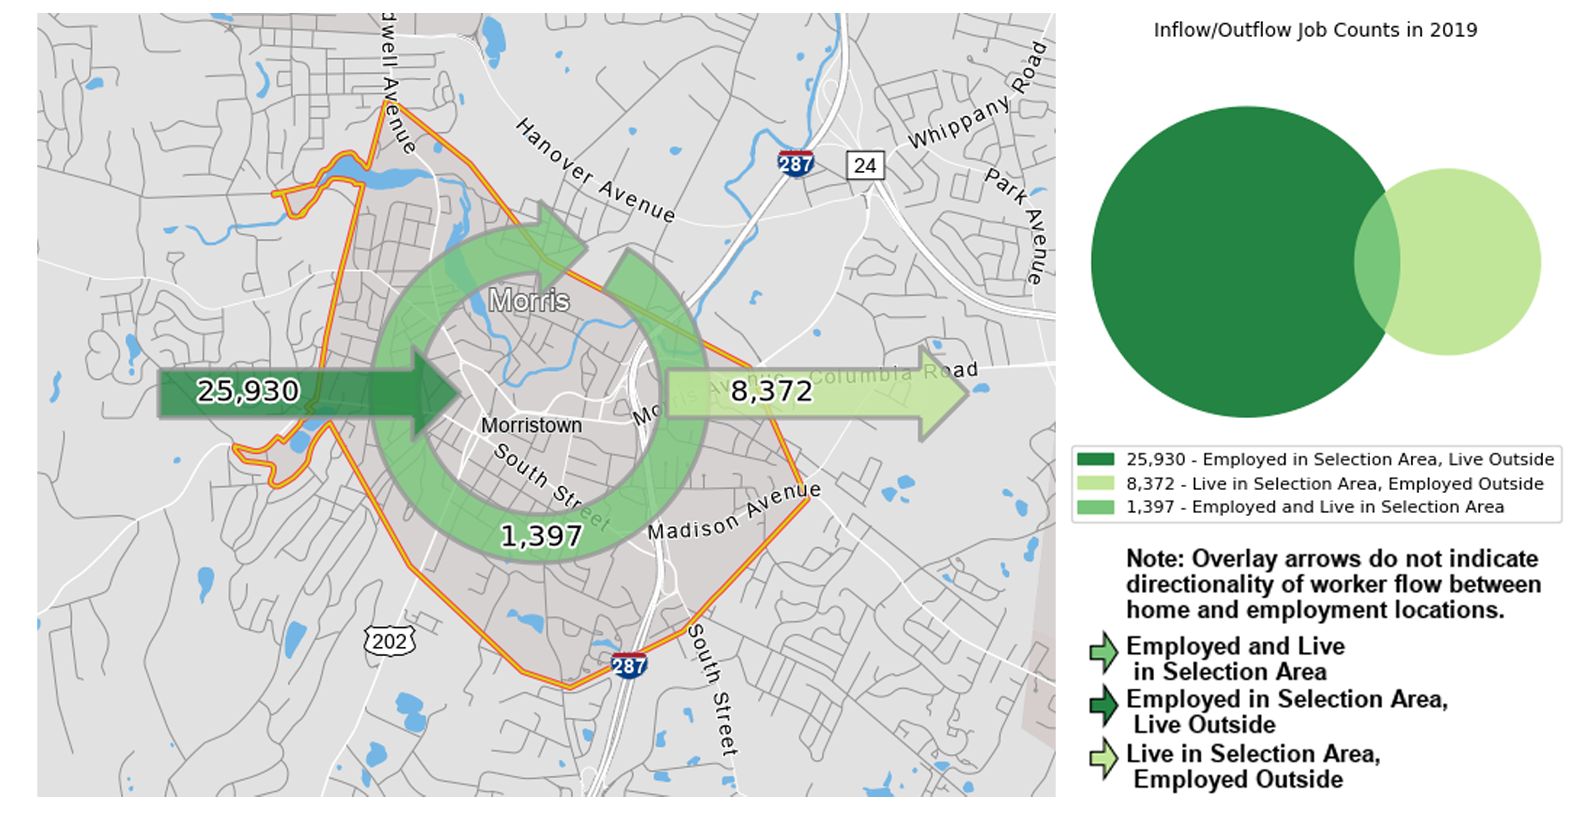
| Inflow/Outflow Job Counts (All Jobs) | |||
| 2019 | |||
| Count | Share | ||
| Employed in the Morristown | 27,327 | 100.0% | |
| Employed in the Morristown but Living Outside | 25,930 | 94.9% | |
| Employed and Living in Morristown | 1,397 | 5.1% | |
| Living in Morristown | 9,769 | 100.0% | |
| Living in Morristown but Employed Outside | 8,372 | 85.7% | |
| Living and Employed in Morristown | 1,397 | 14.3% | |
Source: U.S. Census Bureau
![]()